More about the Bar Charts

I have just previously discussed about the Japanese Candlesticks and on this post, we are going to deal with the Bar charts

Open-up your trading platform and select the Bar Chart which are most commonly found on the top navigation. 

I'm currently using the Meta Trader Platform since it's still the best trading terminal that you can easily gain access for free and it has hundreds and thousands of available tools. 

If you are having some trouble looking for the right tool then I suggest asking them on any Forex Community forums.

The same as the Japanese CandleStick, the Bar Chart is another form of graphical representation of the market prices. You will notice that it composes of a vertical bar as the body. 

The opening price of the market is indicated by the horizontal line which is on the left side while the closing price is on the opposite. 

I find it a little bit confusing where you need to take a closer look by using the "Zoom" function.

Depending on the type of strategy that you use, you have the capability to apply Bar chart on any Time Frame that you choose. 

The most commonly used time interval is the 1 hour period for the Scalpers while Daily or higher for the Day Traders. 

The most important part is that you are able to obtain the real time prices of the market.

Below is an image of how a Bar Chart looks like. I've taken it from my Meta Trader terminal with a black background. You can customize the colors of your chart which is another good part of using the MT4 terminal.

Bar Chart on Meta Trader 4

This next image is a closer view of a single Bar with identified parts.


The top and bottom edge of the vertical bar indicates the Highest and Lowest price attained by the market. Those two short Horizontal lines determines the Open and Close price.

The use of this type of chart depends on the trader. If you find Bar Charts a lot more simpler and easier for you to understand and identify the trends then you should keep on using it. 

Although, the majority of traders these days now prefer the use of the Candlesticks.

The Basic Explanation about Japanese Candlesticks

Before you proceed on trying to read this post, it is fully expected that you are already familiar about your trading platform and you played with the three different types of charts which are the Line, Bar and Candlesticks

Anyway, the main focus of this post is all about the Japanese Candlesticks. The other two types of charts are also useful but don’t provide much data as compared to our main subject.

Let’s have a brief explanation about the difference of these three types of charts. The Line Chart is the simplest among them where it simply plots the highest and lowest prices in the form of a line. 

The Bar Chart provides exactly almost the same type of data as compared to the Japanese Candlesticks but its appearance makes it hard enough to read and can be very confusing. 

Finally, the Japanese Candlestick is the best type of reference which is what we are about to discuss why?

Moreover, let’s give some credit to the creator of this genuine technical analysis tool. Candlesticks won’t exist without him. 

He is Steve Nison who was able to discover this reliable forex trading tool but with the help of his fellow Japanese broker. 

The popularity of the Candlesticks began around the 90s and has become the primary charting tool of every trader around the world.

How does a Candlestick look like?

If you are not sure among the three different types of charts on your trading platform on which is the Candlestick then below is an example.


Now, that you are sure about how does it look like then I suggest that you open your trading terminal to check it out. However, you might also notice the “Time Frame”. So what is it?

Time Frames are the division of time period which can be in minutes, hour, day, weeks, months and year. The uses of the Candlestick on these time frames have no limitations.

Going back to the image posted above, let me explain to you the parts of a Japanese Candlesticks:

The default or most commonly used customized color for reading Candlesticks is “White and Black”. A white type will only be formed when the closing price is above the open. 

When the opposite occurs where the close price is below the open, a black type of candle will be formed.

You must take note of the parts since I will be referring to them on my future tutorial and you don’t want to keep on trying to read this post again for a re-cap.

The rectangular shaped section is what they referred as the “Real Body” of simply body. On the ends are some thin lines poking above and below. 

These are called “Shadows” which indicates the High and Low prices.

Forex Tools and Computer Requirements

If you have just recently encountered Forex as one of the best online investment that could provide you huge profit in return then there are a few requirements that you need to know about regarding the tools that are to be used and the capability of your computer.

Let’s start with the discussion about the software tools.

After you have found a reliable FX Broker they are going to provide you their Deal Station software. This is also known as the “Trade Station” or “Trading Terminal”

The use of this software allows you to have an access with the currency pairs and place your trades. 

Other details are also provided such as the Dealing Rates, Open Trades, Entry Orders, Account Balance, News and etc… The more information that they could provide means the better.

Most Deal Stations offers you the charting platform and the most popular among them is the Meta Trader 4 or more commonly known as the “MT4” for short. 

You can download this Trading Terminal for free and it is popularly shared on most Forex related websites.

The Charting Platform of your Trade Station should consist of various sets of technical indicator tools and provides you multiple different time frames. 

The most common time frames used are the 1, 5, 10, 15, 30, minutes, 1 hour, 4 hour, Daily, Weekly and Monthly. 

Take note that some traders will only use a certain range of time frames to base their analysis and speculations.

The Computer Requirements

You won’t be able to perform your trading activity if you do not have your own personal computer and it is a must requirement. 

Anyway, your computer should be fast with a processor of Pentium 3 or higher. Lower than what is mentioned here will still allow you to install and use the Trading Terminal but you will be experiencing lags and delays on placing your trades.

The minimum required RAM should be 256 Mb but there are still some instances where your computer goes slow and these are due to some malicious files that might have infected the system. 

Therefore, it is recommended to increase your computer’s RAM to avoid such problem.

Having huge or dual type of monitor screen is just optional where an ordinary type works just fine. 

However, the use of huge screen or dual monitors provides you an additional advantage on trying to keep an eye on your multiple charts.

Fast internet connection is also recommended where you have to subscribe on those Broadband or ADSL services. 

Dial-up connections might also be good but there are some situations where the connection goes unstable.

You should only use those Windows Operating systems such as the Windows 2000, XP, 7 and etc… because most of the software offered only works on this OS.

Moreover, if you have not yet found any Forex broker that you wish to invest your capital then there are a few important things that you should need to consider. 

Honesty and Reliability are the two most important factors that you need to know about. The forums and blogs are the good places to check the reputation of the Broker that you intend to join. 

Try and ask those individuals who are using their services whether they are fully satisfied or disappointed.

Meta Trader Email
Meta Trader Email Settings

The Security of your information must not be shared from any third parties of your Broker. 

If they do, you will be surprised to receive an email-spam and you might even receive anonymous calls offering you their products.

Accurate Order Execution is very important because every pips count. You can check the accuracy of any broker’s Order Execution with their Demo or Virtual Account.

Marketiva Platform Review

Most forex traders are already aware about the existence of Marketiva where it offers attractive features and services. 

You can even start trading the market for free by simply registering an account. Take note that creating multiple accounts is strictly prohibited and it must be avoided.

One of the best features of Marketiva is their Customer Support that actively answers all related concerns and issues about their trading platform. 

You can contact them through the Chat-Box where you will receive an immediate reply. Some delay can be experienced if there are too many inquiries but this rarely happens.

The bonus for successfully creating an account is worth $5 dollars

They might change this amount to increase more traders’ interest to join but I think that this will never going to happen as they already accumulated huge numbers of traders. 

You can freely use your bonus to trade Live but you are not allowed to withdraw this cash unless you have managed to triple the amount.

Other requirements before you are allowed to withdraw your earnings are scanned copy of your valid ID (Identification Card) and any Proof of Billing containing your name and current address. 

You have to send these documents for confirmation on Marketiva’s official website under the Account Center. It might take a few days before your documents are checked but normally it takes around two to three days period.

Marketiva’s platform is known as the “Streamster”

Its file size is 524 KB where it simply takes slight seconds to be downloaded. After completing the download, you have to install the program on your Operating System. 

Take note that Streamster will only work on Windows 98/ XP/ ME/ 2000/ 7 and Vista. To all MAC or Linux users, it’s too sad to that they are not currently support.

The trading platform offers two types of an account which are the Demo and Real Account. The Demo account provides you a default amount of $10,000 dollars that you can use for practice purposes. 

If you have lost this entire amount then you can contact the service support to reset the amount. The Real account contains your investment or deposited money. Your $5 dollar bonus is automatically added on this account.

Meta Trader Virtual Account

Streamster currently supports 20 different currencies with spreads that ranges from 2 and above. There might be changes on this part as they conduct upgrades to further improve their services.

Gaining profit on trading the Forex market can be easily done provided that you have good knowledge and strategy. 

This will allow you to withdraw your profit or simply re-invest to increase your capital. Anyway, you can withdraw your earnings on Marketiva through e-dinar, Liberty Reserve, Web Money and Wire Transfer.

Trading the Breakouts with great Success

There are currently hundreds of available trading methods out there that it will surely take you years of trying and defining what works best for you. 

Most strategies are the technical or mechanical type of trading style where the aim is to simply buy at the lowest price and sell at the highest price of the current market. 

The reason is that the behavior of the market often goes for a trend and comes back at the normal price level.

Some traders especially newbie think that they can make money by simply predicting the direction of the trend. Predictions offer a huge risk and often lead into a complete failure and lose of an account.

One of the best method that guarantee your success in trading the Forex market is to trade only on a high odds where there is a good confirmation of the trend’s direction. 

Try and observe your trading chart. You will notice that the bullish trend always starts in the same manner especially when it breaks through overhead resistance. 

Sometimes it even moves further making a new high and it’s the reason why it’s best to make a buy on breakouts.

Defining for buying at the right breakouts can be done with the help of your resistance levels

If the resistance has been tested several times in the past and held before the break then there is a high probability that a bullish trend continuation will mostly likely going to occur.

A six or more tests are already good enough to confirm the strong level of the resistance. The wider the gap of the tests in terms of time provides the best odds for the breakout to continue.

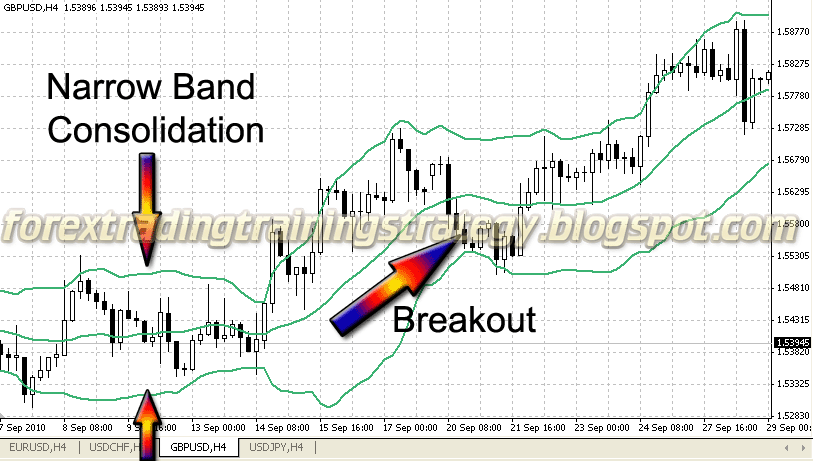
Bolinger Band Break Out
The Bolinger Band Breakout

Trading the Breakouts offers a very high reward and with a very low risk of losses because the stop loss is always close or near the level of resistance. 

If you managed to hit the high odds of a certain breakout then your profit can tremendously increase depending on how far the range of the market will trend.

You may simply choose just to trade on the break of resistance levels but you can also choose to use other tools such as momentum oscillators to further confirm the best signal that you wish to take.