The Forex market allows anyone to participate on the currency trading business.
Some of these participants are the Governments, Reserve Banks, Large Mutual Funds, Hedge Funds and even Individual traders at home.
I myself is an individual trader where all I need to join the trading exchanges is a computer with a stable internet connection.
If you have been on some other related Forex websites or Blogs then you must have been already warned about the danger and risks of losing your investment.
If you have been on some other related Forex websites or Blogs then you must have been already warned about the danger and risks of losing your investment.
Through the years of my trading career, I have lost numerous times and it is due to greed and lack of education.
This has proven that trading Forex is totally risky especially when you do not know exactly what you are doing.
The most important factor that every trader should try to develop is their analytical skill to analyze the behavior of the market.
The most important factor that every trader should try to develop is their analytical skill to analyze the behavior of the market.
These are the fundamental and technical method of trading style. However, more guaranteed result can be achieved by combing the two methods.
The main focus of this Fundamental Analyst is to study the condition of the Economy, Social, Political and Geographic forces influencing the type of currencies that are being analyzed.
The main focus of this Fundamental Analyst is to study the condition of the Economy, Social, Political and Geographic forces influencing the type of currencies that are being analyzed.
These factors have the potential to drive the supply and demand on a certain level of prices.
The primary tools of the Fundamental Traders are the Micro-Economic indicator such as the Interest rates, Inflation, Unemployment, Economic Growth Rates and etc…
The primary tools of the Fundamental Traders are the Micro-Economic indicator such as the Interest rates, Inflation, Unemployment, Economic Growth Rates and etc…
Analyzing these events on how they are going to affect the behavior of the traded currencies is the hardest part where only a financial expert is capable of doing.
However, even professionals do commit mistakes on their analysis so it’s always best to be prepared on taking the risk.
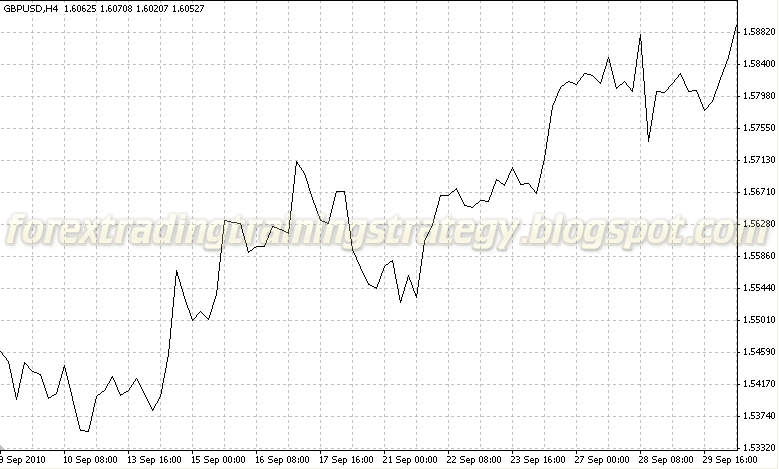
Technical Analyst tends to study the previous price movement of the market. They analyze the past historic data of the currencies and based their decision in trying to predict the future price trend direction.
Technical Analyst tends to study the previous price movement of the market. They analyze the past historic data of the currencies and based their decision in trying to predict the future price trend direction.
All technical traders believes that the “Market repeats itself” which mean that the next trend can be determined by studying Price Action.
The basic tools of a Technical Trader are charts where they use it to define profitable trend and patterns.
The basic tools of a Technical Trader are charts where they use it to define profitable trend and patterns.
The concept of their analysis is that the market will always move in two different directions which is either Bearish or Bullish condition.
Their aim is to be able to define the best possible entry level before the trend starts to be developed.
Whatever type of trading style that you prefer to adopt, the most important part is that you are gaining profit and enjoying the method without suffering too much stress.
 |
| Past Historical Data |
Whatever type of trading style that you prefer to adopt, the most important part is that you are gaining profit and enjoying the method without suffering too much stress.
