Showing posts with label Chart Patterns. Show all posts

Making SELL or SHORT Order from A Retracement

Retracements are a common occurrence in financial markets and can provide traders with a great opportunity to make sell or short orders. In this blog post, we'll explore what retracements are, how to identify them, and the strategies involved in making sell or short orders from retracements.

Retracements are a temporary reversal in the direction of an asset's price movement. They occur when the asset's price moves in a direction opposite to the trend before resuming its original trend. For example, if a stock is on an uptrend, it may experience a brief period of downward movement before continuing to rise again.

Making sell or short orders from retracements can be a profitable strategy if done correctly. However, it's important to understand the risks involved and have a solid trading plan in place. Let's dive deeper into the world of retracements.


Understanding Retracements


Retracements are a common occurrence in financial markets, and understanding what they are and how they are formed is crucial in identifying potential sell or short opportunities.

A retracement is a temporary reversal in the direction of an asset's price movement. They occur when the asset's price moves in a direction opposite to the trend before resuming its original trend. For example, if a stock is on an uptrend, it may experience a brief period of downward movement before continuing to rise again.

Retracements are typically caused by a combination of profit-taking and market sentiment. When an asset's price has been rising for an extended period, traders may take profits by selling their shares, causing a temporary drop in the price. This profit-taking can be triggered by a variety of factors, such as news events or technical indicators.

Retracements can also be caused by changes in market sentiment. If the market is bullish, and there is a sudden shift in sentiment, traders may begin selling their shares, causing a temporary drop in the asset's price.

There are several types of retracements, including Fibonacci retracements, price channel retracements, and time retracements.

Fibonacci retracements are the most commonly used type of retracements. They are based on the Fibonacci sequence, a mathematical sequence in which each number is the sum of the two preceding numbers. Fibonacci retracements use horizontal lines to indicate areas of support or resistance at the key Fibonacci levels of 23.6%, 38.2%, 50%, 61.8%, and 100%.

Price channel retracements are based on the concept of support and resistance. A price channel is a range in which an asset's price moves, with support at the lower end of the range and resistance at the upper end. When the asset's price moves outside of the channel, it may experience a retracement back to the channel's support or resistance level.

Time retracements are based on the idea that trends repeat themselves over time. They are often used in conjunction with other technical indicators to identify potential areas of support or resistance.


Identifying Potential Sell or Short Opportunities


Identifying potential sell or short opportunities from retracements requires a combination of technical analysis and market knowledge.

The first step in identifying potential sell or short opportunities is to identify the retracement. This can be done by looking for a period of price movement in the opposite direction to the trend, followed by a resumption of the original trend.

Once the retracement has been identified, traders can look for potential resistance levels. Resistance levels are areas where the asset's price has previously struggled to move past. These levels can be identified by looking at previous highs and lows or by using technical indicators such as moving averages or trend lines.

Traders can also use technical indicators to confirm the retracement. For example, if the asset's price is above its 200-day moving average, and the moving average is sloping upward, it may indicate that the asset is on an uptrend. However, if the price drops below the moving average, it may indicate a retracement.

Another useful tool for identifying potential sell or short opportunities is the Relative Strength Index (RSI). The RSI is a momentum indicator that measures the strength of an asset's price movement. It ranges from 0 to 100, with readings above 70 indicating overbought conditions and readings below 30 indicating oversold conditions.

When using the RSI to identify potential sell or short opportunities, traders should look for readings above 70 followed by a drop below 70, indicating a potential retracement.

Making the Sell or Short Order


Once a potential sell or short opportunity has been identified, traders can make a sell or short order. The process for making a sell or short order is similar to buying an asset, with a few key differences.

When making a sell or short order, traders must specify the quantity they wish to sell and the price at which they want to sell. They must also specify whether they want to place a market order or a limit order.

A market order is an order to sell the asset immediately at the current market price. This type of order is useful when traders want to sell the asset quickly and are willing to accept the current market price.

A limit order is an order to sell the asset at a specific price or better. This type of order is useful when traders want to sell the asset at a specific price and are willing to wait for the price to reach that level.

When making a sell or short order, traders should also consider setting stop loss and take profit levels. A stop loss is a predetermined level at which traders will exit the trade if the asset's price moves against them. A take profit level is a predetermined level at which traders will exit the trade if the asset's price reaches their target.

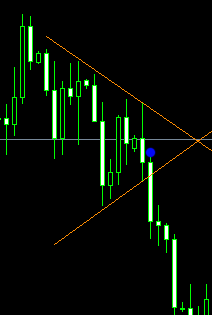
On the example shown below, there are 4 numbers that plays an important role on this retracement strategy. Number 1 is where the price starts. On this case the market condition is bearish or going down. From point 1 it moves to point 2. You will notice that in point 2, the candlesticks had bounced up due to a support line which then formed point 3. Point 3 is what exactly we have been waiting for because its where the retracement will be formed.


Take a closer look into our example once more. You should notice the small white dot on top of the third candle from point 3. At that level, you should enter your SELL or SHORT order exactly by the time that the third candle show up.

Where to put the stop loss?

Look again into our example above until you see the orange-horizontal line. That will be the level of your stop-loss. Always provide some slight allowance to the highest price of the highest retracement candle.

What about the target profit?

Point 4 clearly indicates the level where you should be putting your TP or target profit.

This ends our discussion about retracement. If there are some part that are still unclear to you, feel free to post them on the comment form provided below or if you want to have a private conversation then you can send your concern on my email which can be found at the bottom of this post.

Managing the Trade


Managing the trade is an essential part of making sell or short orders from retracements. Traders must monitor the trade for potential changes in the market and adjust their stop loss and take profit levels as needed.

One way to manage the trade is to move the stop loss level closer to the asset's price as it moves in the trader's favor. This can help minimize potential losses if the asset's price suddenly moves against the trader.

Traders can also adjust their take profit level as the trade progresses. For example, if the asset's price has moved in the trader's favor, they may want to move their take profit level closer to the current market price to lock in profits.

Another important consideration when managing the trade is identifying when to exit the trade. Traders should have a predetermined exit strategy in place before entering the trade, based on their trading plan and risk tolerance.

Risks and Considerations


Making sell or short orders from retracements can be a profitable strategy, but it's essential to understand the risks involved.

One of the main risks associated with making sell or short orders from retracements is that the asset's price may not continue in the trader's favor. If the asset's price resumes its original trend, the trader may incur losses.

To minimize this risk, traders should have a solid trading plan in place and use technical indicators and market knowledge to identify potential sell or short opportunities.

Another risk to consider is that the asset's price may move suddenly and unpredictably, particularly if there is a significant news event or market disruption. Traders should have a stop loss in place to limit potential losses if the asset's price moves against them.

Conclusion

Making sell or short orders from retracements can be a profitable strategy if done correctly. Traders must understand what retracements are, how to identify potential sell or short opportunities, and the risks involved. By using technical indicators, such as moving averages and the Relative Strength Index, traders can increase their chances of success.

Traders should also have a solid trading plan in place and be prepared to manage the trade actively. This includes setting stop loss and take profit levels, adjusting them as the trade progresses, and having a predetermined exit strategy in place.

While there are risks associated with making sell or short orders from retracements, traders can minimize these risks by using proper risk management techniques and having a thorough understanding of the market.

In conclusion, making sell or short orders from retracements can be a profitable strategy for traders. By using technical indicators, having a solid trading plan in place, and managing the trade actively, traders can increase their chances of success. 

However, it's important to remember that there are risks involved, and traders must be prepared to manage these risks effectively. With the right knowledge and skills, traders can use retracements to their advantage and make profitable trades in the market.

Entering BUY or LONG Entry from A Retracement

Before you consider on applying this method into your trades, I expect that you should already have read the previous post which was all about the 'Retracement System'. On this post, you will get to learn how to properly gain entry on a bullish market condition from a retracement. Take note, this method is only applicable on a bullish market trend.

Entering SELL or SHORT entry from a retracement will be discussed on the next post.

How to start?

The image shown below is an example of a good retracement. The market trend started at point 1 going to point 2. At point 2, the trend seemed to have exhausted so it retraces back a little to point 3. This is where the most important part that you may need to stay on your sit for a while to be able to take the perfect opportunity to open a BUY or LONG entry order.


If you take a closer look into the illustration above, you will notice the small white-dot. Below the white-dot is the candle where you should be entering or placing your order.

As for the stop-loss, it should be slightly below the point 3's lowest price level that the candlestick had managed to reach. As you can see on our example above, I had set the stop-loss just slightly below the lowest price attained by the lowest candlestick of the retracement.

What's the use of the number 4 on the illustration above?

The number 4 which is also indicated by the orange horizontal line is the level where you can set your 'target-profit' or 'TP'. This is actually optional that when you do not have the time to baby-sit your trade, you can just let your position ride along the trend. But for maximum profit, it is best to set your TP then gain entry all over again on every retracement that occurs on the trend.

Retracement System - You will Only Be Wrong Once

A newbie might think, 'What is a retracement in the definition of forex trading?'. Retracement is actually small ranges of reversals of a trend that take-place in either bullish or bearish condition of the market.

Try to open your trading platform and look for long market trend somewhere in the past. You will notice that the trend goes up and down. Those fluctuations of the prices were called 'retracements'. If you are looking at a bullish trend, then the retracements that were formed were those bearish trend attempts.

Confused? if you are then here's an illustration that will help you out with a better explanation and understanding.


Above is an example of retracement on a bullish market condition. There are actually two retracements on the given example above in which I encircled it with the blue color. Notice how the trend continued to go up just after hitting the retracement levels?

Here is another retracement example on a bearish market condition:


On the image above, the market was on a bearish condition and it has made multiple retracements indicated by the blue circles.

How Can You Only Be Wrong Once?


Retracements are actually good entry points. So if you are late at entering your trade from a good trend, the best way to gain entry is by opening your order right exactly from the next retracement level. Professional traders claims that 'you will only be wrong once' and that is when you have entered at the top or bottom of the trend.

Common saying among all professional traders are 'Always buy dips in a rally' or 'Always sell rallies in a downtrend'.

How do you exactly determine the level of the retracement of a trend?

Determining the retracement level of a certain trend can be done through various means. You can rely on Fibonacci levels, support, resistance, pivot points, previous high/low and etc... Based on my own experience, I find it best to rely with the supports and resistances.

Bear Trap - Example of False Break on the Support Line

After learning something about 'Bull Trap' from the previous post, you are now about to learn its opposite counter-part known as the 'Bear Trap'.

Bear Trap is actually a false break-out that only occurs in the support level. Encountering bear traps on your trade could lead into losses and messes your interpretation from your chart pattern.

In order for you to have a clearer and better understanding about bear traps, lets have some few examples:


On the image above, you will notice the two horizontal lines. The orange-horizontal line is the resistance level of the trend while the red-horizontal line is the support level. Basing it on the trend, you will notice that the candlesticks made multiple attempts to break the support and resistance levels until the they finally did it at the support level. The portion where I encircled were the group of candles that confirmed the breakout. Suddenly, the seventh candlestick goes back in the opposite direction.

Here's another example below:


Its almost the same as the first example above wherein the breakout was clearly shown on the portion that I encircled. It consisted of six candlesticks before it has decided to go back in the opposite direction.

How to Avoid Bear Trap False Breaks?


Avoiding bear trap depends on many different circumstances. Other professional traders actually have their own secret method on how to deal with them. But as for me, my main method is to properly setup your stop-loss. Yes you will be attaining losses but you will be earning more once you have known that they were just false breaks.

For beginners, it is important for you to learn how to accept your losses. It is actually normal to lose some of your trades that even professionals do also incur losses. When I was a beginner, one of my greatest mistake was looking for the best possible method that does not lose or in short 'the holy grail'. Well, it took me a lot of years chasing for a method that does not exists.

Bull Trap - Example of False Break on Resistance Level

In the previous post, I had discussed all about 'How False Breaks Occurs On a Chart Pattern'. For some, my explanation may not be still clear enough to be understood by a complete newbie or beginners. So on this post, I will be providing some additional examples.

'Bull Trap' is actually the other term of False Break but its a little bit more specific because it tells you that the false break had occurred in a bullish market trend.

Below is an example of a bull trap which I found on the 4 hour Time Frame chart of USD/CHF. You will notice that the resistance line was formed due to the multiple attempts of the candlesticks to break-through the level. The resistance line is designated by the orange horizontal line.


The red-horizontal line is the support line which has been touched once before it suddenly goes up to break the resistance level. For the newbie, I encircled the part where the candlestick had broke the resistance line. You can see that there are three candlesticks that went off the line before the trend changed its mind to go back in the opposite direction.

Here is another example:


Just like from the example above, the resistance level is indicated by the orange horizontal line while the support level is indicated by the red horizontal line. On this second example, you will notice that the resistance level has been broken two consecutives times and they were false breaks. It then suddenly goes back and headed-straight downwards.

How to Avoid Bull Trap?


There is no single method on how you can avoid bull trap due to its varied instances. So to teach you how, I'll give you an example on how to deal with the false break on the second example that has been given above.


You will notice on the image above that I had added a dotted line above the orange-horizontal level. I now consider the peak of those false breaks as resistance. This dotted horizontal must be put in-place by the time that the first false break-out had occurred. On the trend's second false attempt, I wouldn't be falling for it unless it breaks-through the dotted resistance line.

Below the red horizontal support line, you will notice the small-white dot. That will be my entry price for going SHORT.

How False Breaks Occurs On a Chart Pattern

'False break' is an action of the market trend wherein it has failed the chart pattern. It is vital for you to learn and fully understand how a false breaks occurs or you will be losing plenty of pips. The good thing is that, when a false break had occurred on your trade its never too late to reverse your trade that still allows your to generate some profit.

How exactly does a false break occur?

To explain to you how exactly a false break occurs, I want you to refer on the image provided below. The image below show a 'bullish pennant' chart pattern. Support and resistance of the trend is indicated by the black line while the blue line is the market's trend. You can see that the market trend had bounced three times on the support and resistance levels but in its fourth attempt, the trend broke through the support line. This could trigger your stop-loss or influence your decision to go SHORT. But then later, the trend goes right up into its speculated direction.


False Breaks Often Occurs During Fast Moves


If you have already been trading with the forex market for awhile then you may have already noticed some fast moving trend of the market. In such cases, false breaks can be often encountered. Here are the following instances on how false breaks occurs on your trades:

1. Fast Reversal on the Previous Pivot Point Levels

Pivot point is a price level wherein there's a high possibility that the trend will reverse its direction once reached or touched. It simply works just like support and resistance lines that once breached the trend will continue to push-through. But what happens when false break occur is that the market price will move past the pivot point level then surprisingly, it reverses for a fast move in the opposite direction.

2. Support and Resistance Lines

Just like the pivot point above, false break occur when the market trend will either break the support or resistance line then suddenly, it rushes back in the opposite direction.

3. Other Chart Patterns

There are actually plenty of chart patterns around but they can be flawed by false breaks.

Moreover, false breaks are a part of the challenge of trading the forex market. And it can only be minimized through the confirmation of other indicators such as the Fibonacci, Bollinger Band and etc... According to some experts, false breaks are tests of previous point of significance.

Bearish Pennant In A Downtrend - Bearish

Bearish pennant in a downtrend is very similar to the previous post entitled, 'Bullish Pennant in An Uptrend - Bullish'. However, their only difference is that bearish pennant pattern only occurs during the downtrend condition of the forex market. You have to know that once you encountered this trading pattern on your chart, it gives you the confidence of making a profit by going SHORT or SELL.

For those who haven't read the previous post, you can draw the bearish pennant pattern based on the support and resistance lines. Wait, how to you draw the support and resistance lines? Everything has been clearly discussed on this post, 'Support and Resistance Levels'.

Below is a figure that clearly illustrate how a bearish trend form a bearish pennant pattern:


The figure above shows that the trend has been constricted by the triangle until right into the near end of its corner where the breakout occurred at the support line. You can see that the trend from the figure had bounced twice on the resistance and support lines. This doesn't mean that the pattern must do the exactly the same on your trade. What's important is that a triangle has been formed.

For a better and actual example, here's a screen-shot that I have taken from my Meta-Trader platform:

Example 1: On this first example, the resistance line has been clearly formed by the multiple candles while the support line was formed by a single bounce then followed by a break-through on its second attempt. If you look closer, you will notice the small blue colored dot. That was my entry level for this trade.


Example 2: This is a bearish pennant pattern that was formed on the daily chart of USD/CHF. Just like from the example above, my entry was indicated by the tiny blue colored dot.


The Proper Way to Use the Bearish Pennant Pattern


Now that you have learned how to plot and interpret a bearish pennant pattern, it doesn't mean that you can already implement it on your actual trades. Applying it the proper way may take time as bearish pennant patterns doesn't often occur. Thus, its best to apply it first on your practice account.

If you want, you can also perform a 'back test' as to how many bearish pennant had occurred on the daily time frame for the whole period of one year. Moreover, if there are something that seems unclear to you about this discussion then feel free to ask them on the comment form provided below.

Bullish Pennant in An Uptrend - Bullish

Bullish pennant in an uptrend is a strong sign indicating that the trend will continue to go up or bullish. It can be easily plotted by drawing two lines. One line is plotted based on the resistance while the second line is plotted based on the support. As a result, the two lines will intersect forming a triangle.

Once you have encountered such type of chart pattern, do not immediately place a BUY or LONG order. Entering at an early period will let you earn less amount of pips. The best way to do it is to enter your order when the current price is near the support lines. However, there's still the risk that the trend may go down. So if you only want to enter at high-probability trade then you have to wait for the breakout at the resistance line.

Below is a figure of how a trend forms a bullish pennant. It really doesn't matter how many times the trend touches the support and resistance lines. What matters is that the trend clearly form a triangle.


To give you a better and clearer example, lets take some of my previous successful trades with the bullish pennant in an uptrend:

Example 1: On this example you can see that the support line has been touched twice while on the resistance line has multiple candlestick attempts of trying to break-through. If you are going to take a closer look into the image, you will see the small-blue dot. That was my price entry-level.


Example 2: On this second example, you should already got or understood the whole idea. The resistance has been touched twice so as the support line. My entry point was again indicated by the small-blue circle dot.


Putting the Bullish Pennant Pattern into Practice


Now that you have learned how to identify a bullish pennant pattern, it doesn't mean that you are ready to apply it into your real trades. Give your self some practice by applying it on a demo account. But bullish pennant pattern doesn't often occur especially when the trend is going down or at bearish direction.

So my best advise is to do 'back trading'. This is a method where you go back into the old chart of your own trading platform then try to identify every possible bullish pennant pattern that you are able to find. If you have encountered a pattern in which you are not sure if its a bullish pennant, you can ask for my help by sending a screen-shot right into my email. For those who are new, my email can be found at the bottom most part.