In the previous post, I had discussed all about 'How False Breaks Occurs On a Chart Pattern'. For some, my explanation may not be still clear enough to be understood by a complete newbie or beginners. So on this post, I will be providing some additional examples.
'Bull Trap' is actually the other term of False Break but its a little bit more specific because it tells you that the false break had occurred in a bullish market trend.
Below is an example of a bull trap which I found on the 4 hour Time Frame chart of USD/CHF. You will notice that the resistance line was formed due to the multiple attempts of the candlesticks to break-through the level. The resistance line is designated by the orange horizontal line.

The red-horizontal line is the support line which has been touched once before it suddenly goes up to break the resistance level. For the newbie, I encircled the part where the candlestick had broke the resistance line. You can see that there are three candlesticks that went off the line before the trend changed its mind to go back in the opposite direction.
Here is another example:

Just like from the example above, the resistance level is indicated by the orange horizontal line while the support level is indicated by the red horizontal line. On this second example, you will notice that the resistance level has been broken two consecutives times and they were false breaks. It then suddenly goes back and headed-straight downwards.
There is no single method on how you can avoid bull trap due to its varied instances. So to teach you how, I'll give you an example on how to deal with the false break on the second example that has been given above.
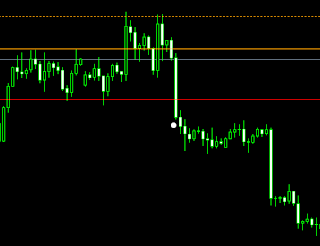
You will notice on the image above that I had added a dotted line above the orange-horizontal level. I now consider the peak of those false breaks as resistance. This dotted horizontal must be put in-place by the time that the first false break-out had occurred. On the trend's second false attempt, I wouldn't be falling for it unless it breaks-through the dotted resistance line.
Below the red horizontal support line, you will notice the small-white dot. That will be my entry price for going SHORT.
'Bull Trap' is actually the other term of False Break but its a little bit more specific because it tells you that the false break had occurred in a bullish market trend.
Below is an example of a bull trap which I found on the 4 hour Time Frame chart of USD/CHF. You will notice that the resistance line was formed due to the multiple attempts of the candlesticks to break-through the level. The resistance line is designated by the orange horizontal line.

The red-horizontal line is the support line which has been touched once before it suddenly goes up to break the resistance level. For the newbie, I encircled the part where the candlestick had broke the resistance line. You can see that there are three candlesticks that went off the line before the trend changed its mind to go back in the opposite direction.
Here is another example:

Just like from the example above, the resistance level is indicated by the orange horizontal line while the support level is indicated by the red horizontal line. On this second example, you will notice that the resistance level has been broken two consecutives times and they were false breaks. It then suddenly goes back and headed-straight downwards.
How to Avoid Bull Trap?
There is no single method on how you can avoid bull trap due to its varied instances. So to teach you how, I'll give you an example on how to deal with the false break on the second example that has been given above.

You will notice on the image above that I had added a dotted line above the orange-horizontal level. I now consider the peak of those false breaks as resistance. This dotted horizontal must be put in-place by the time that the first false break-out had occurred. On the trend's second false attempt, I wouldn't be falling for it unless it breaks-through the dotted resistance line.
Below the red horizontal support line, you will notice the small-white dot. That will be my entry price for going SHORT.
No comments:
Post a Comment